
DATA EXPLORATION
This project explores a company’s data regarding its customers, employees, products, vendors, and departments.
After retrieving the company’s csv files, I created an ER diagram (right table) of the database using MySQL, and connected the table to Tableau where I created 5 Visual Explorations that allowed me to gain more accessible and meaningful insights.
Visit the website to interact with charts by clicking on the photo
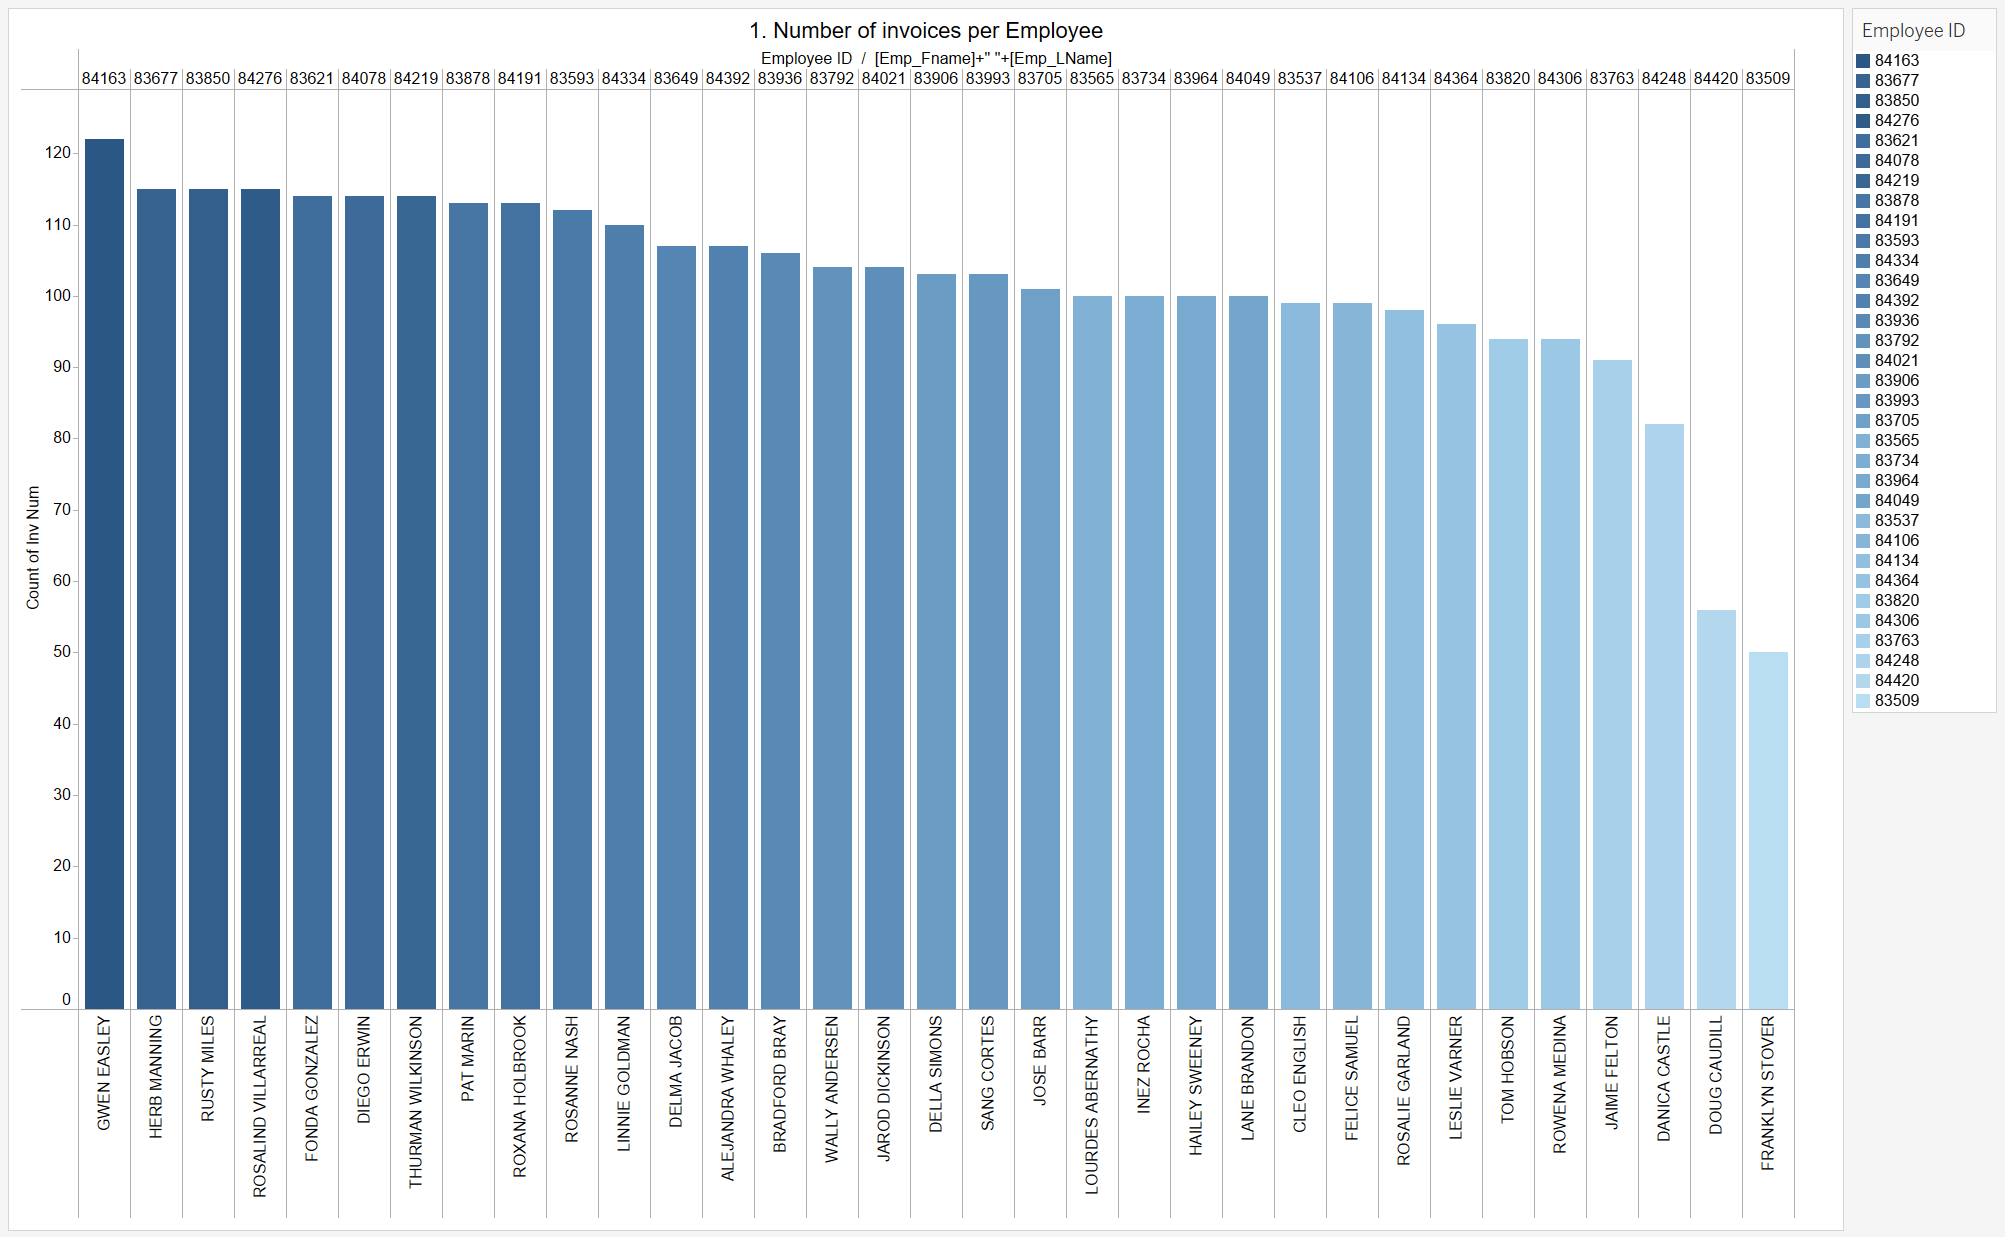
In bar chart style, employees with the most number of invoices have been displayed.
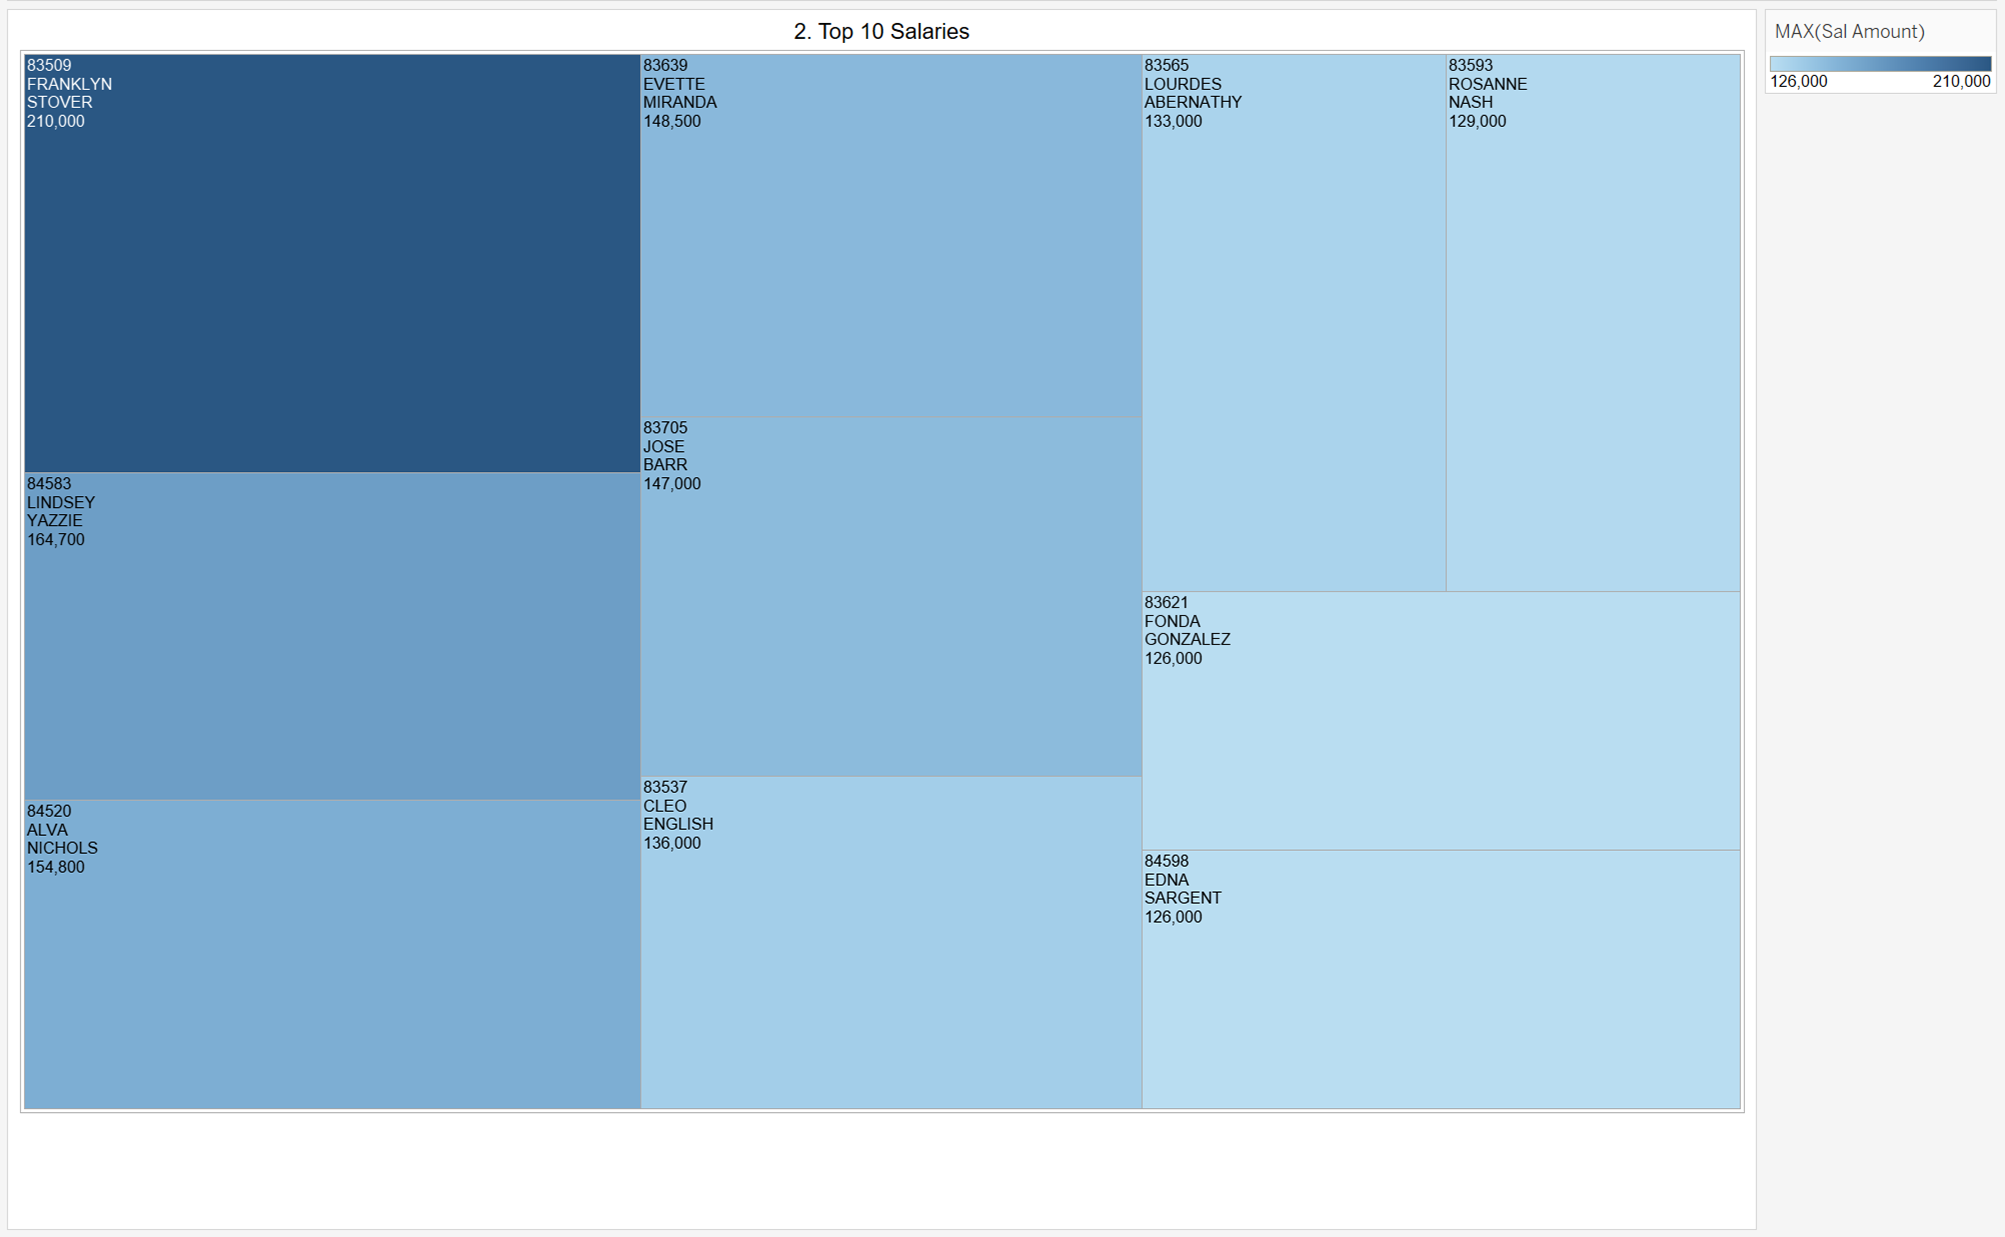
In the style of a TreeMap the top 10 employee salaries have been visualized.
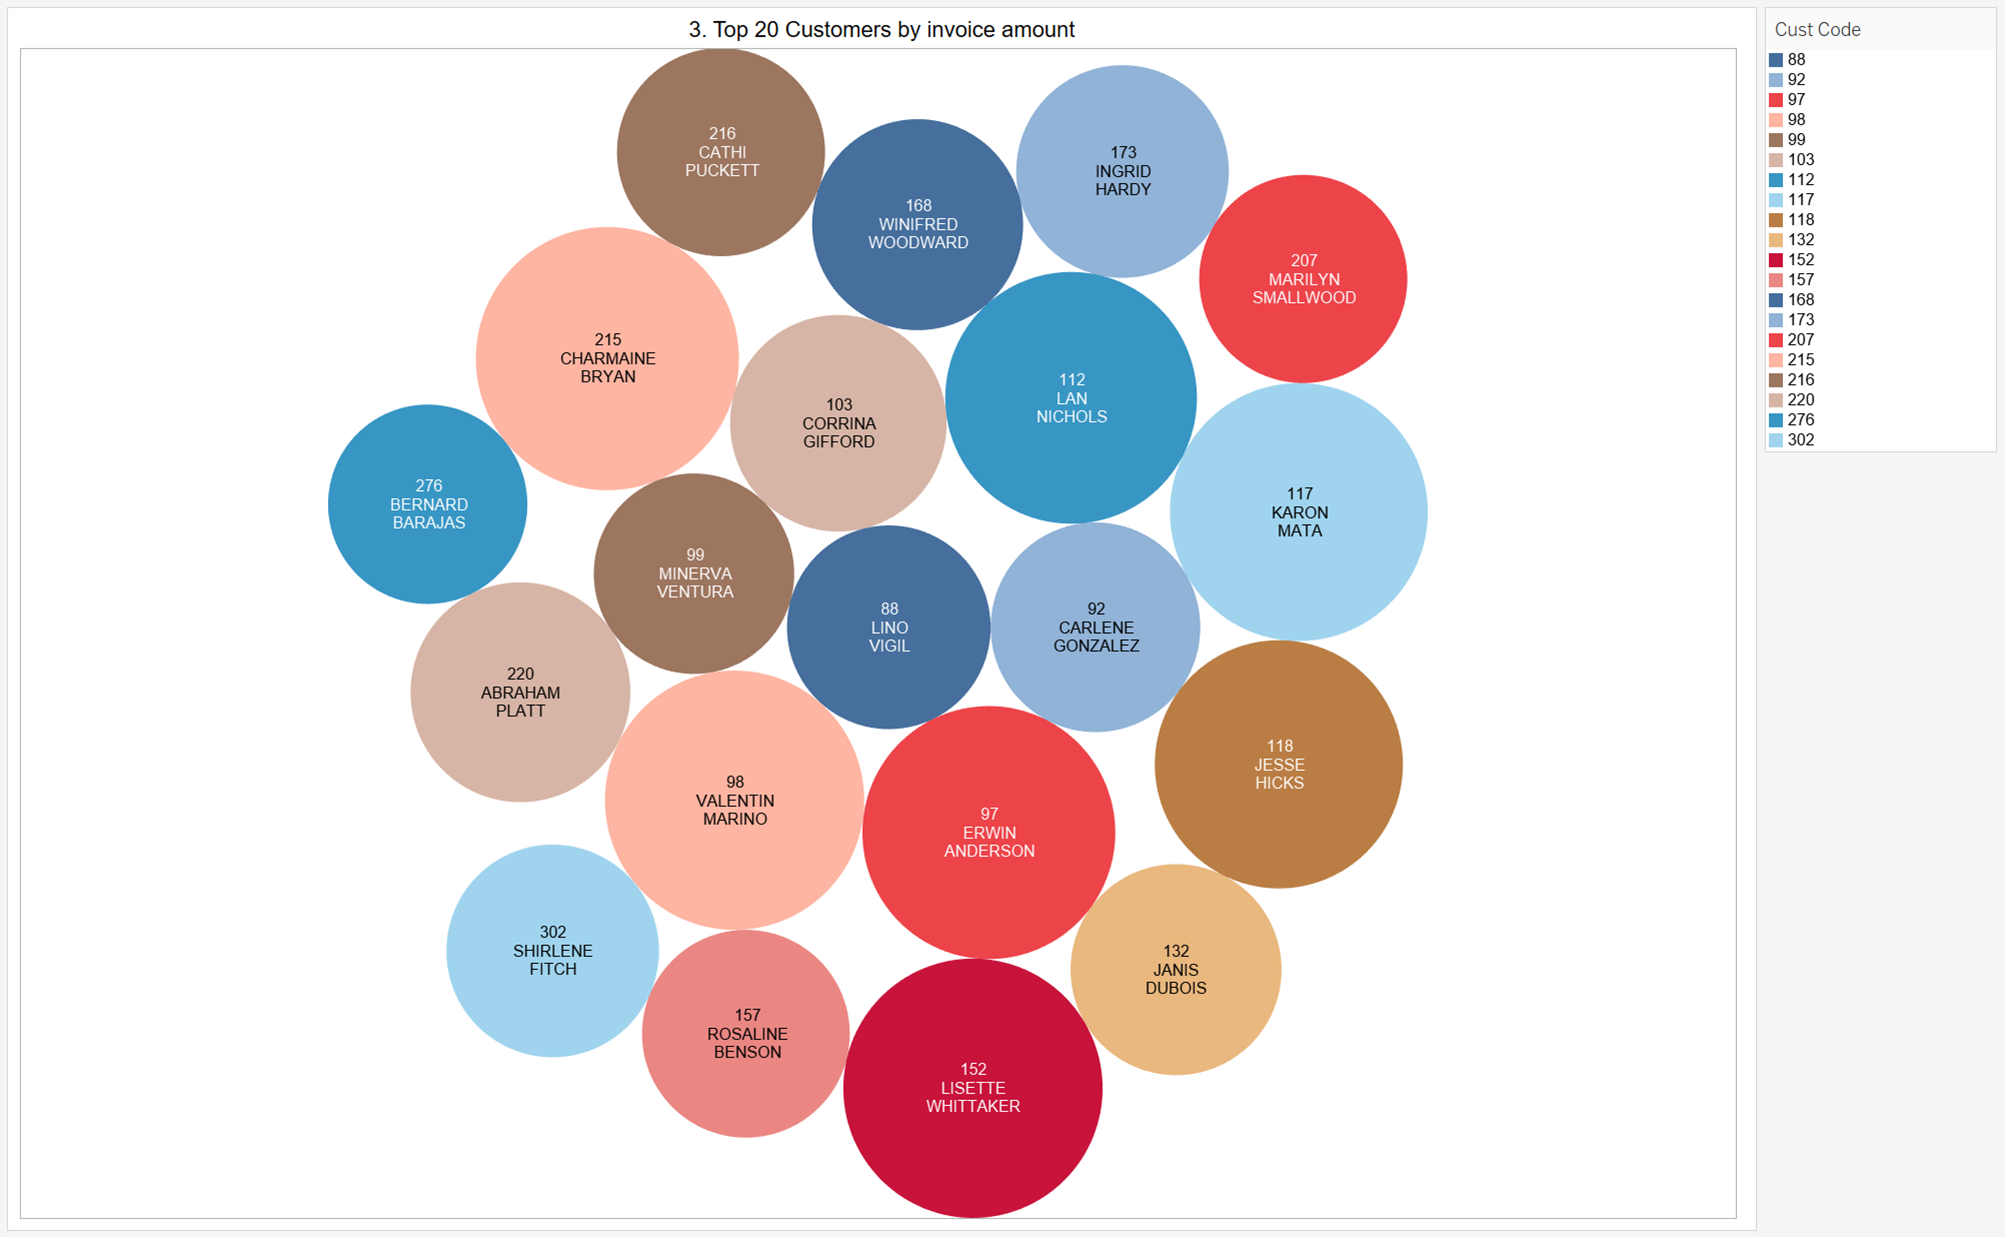
In the style of a bubble chart, the top 20 customers sorted by their invoice totals have been visualized. The greater the size of the bubbles, the higher the number of invoices each customer has.
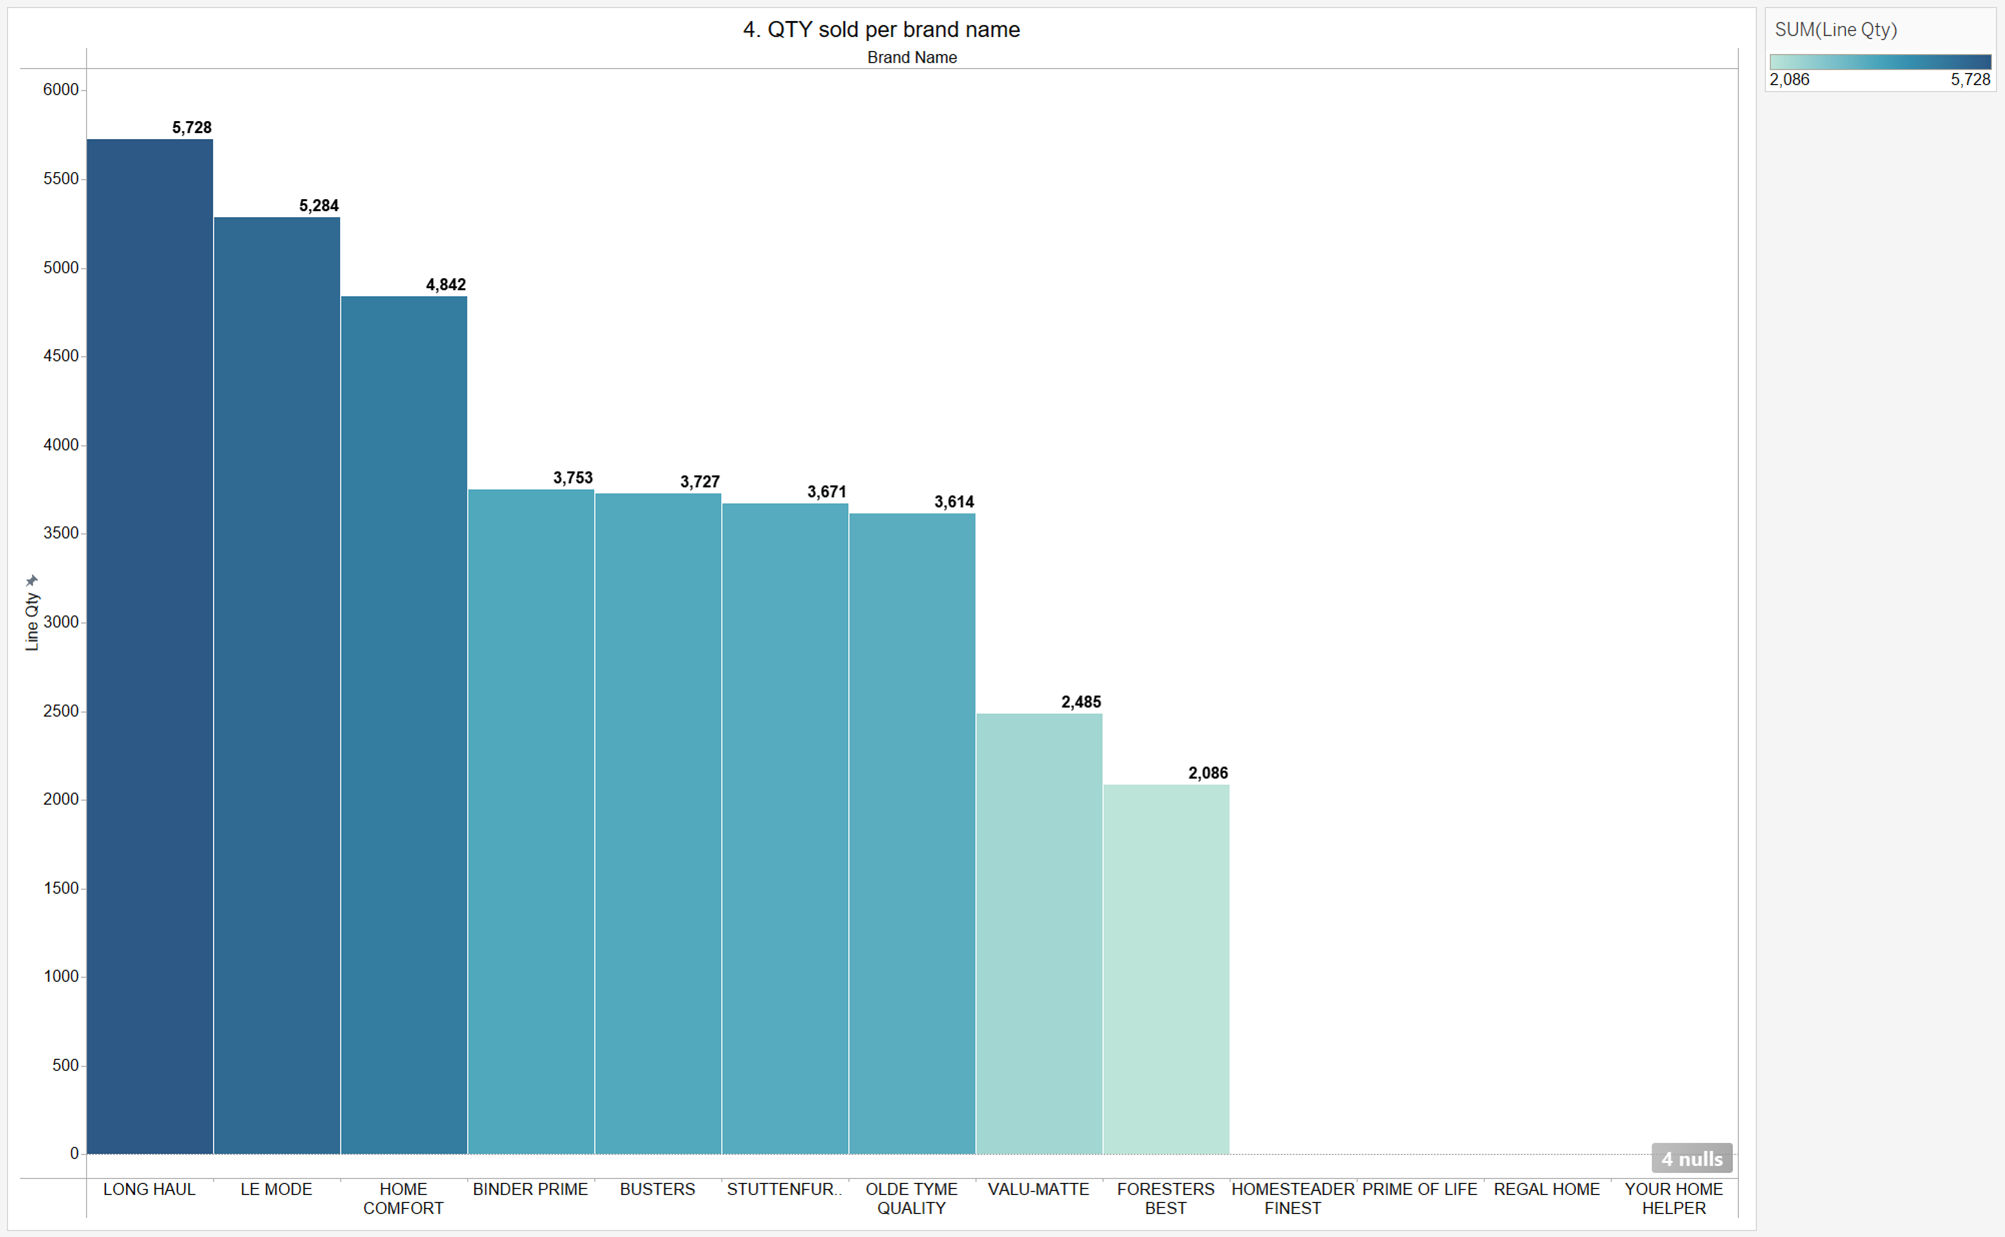
The brand names are displayed in descending order of quantity of products sold.
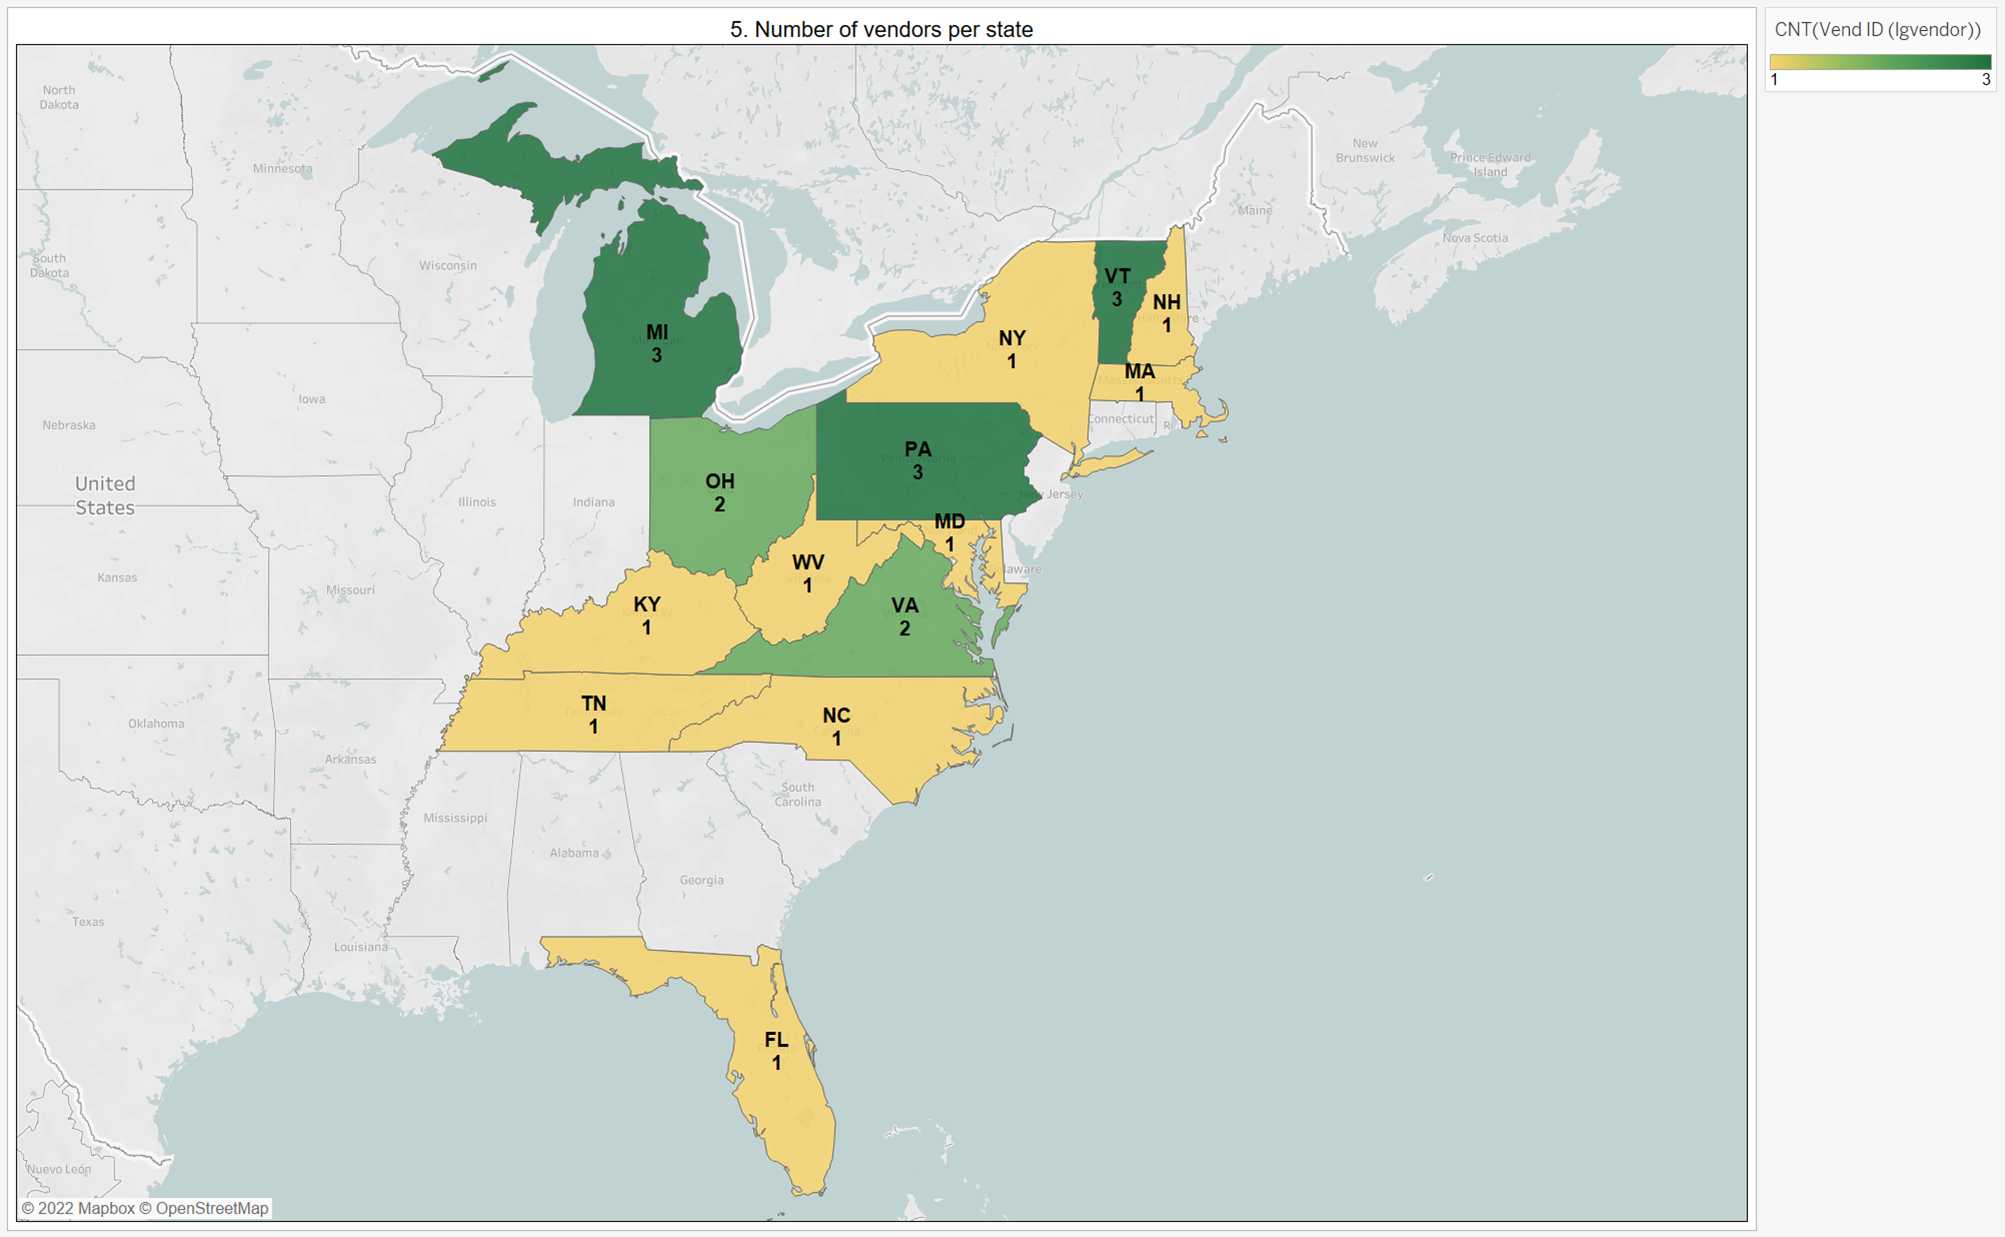
The number of vendors per state is displayed on a map.